Network Status
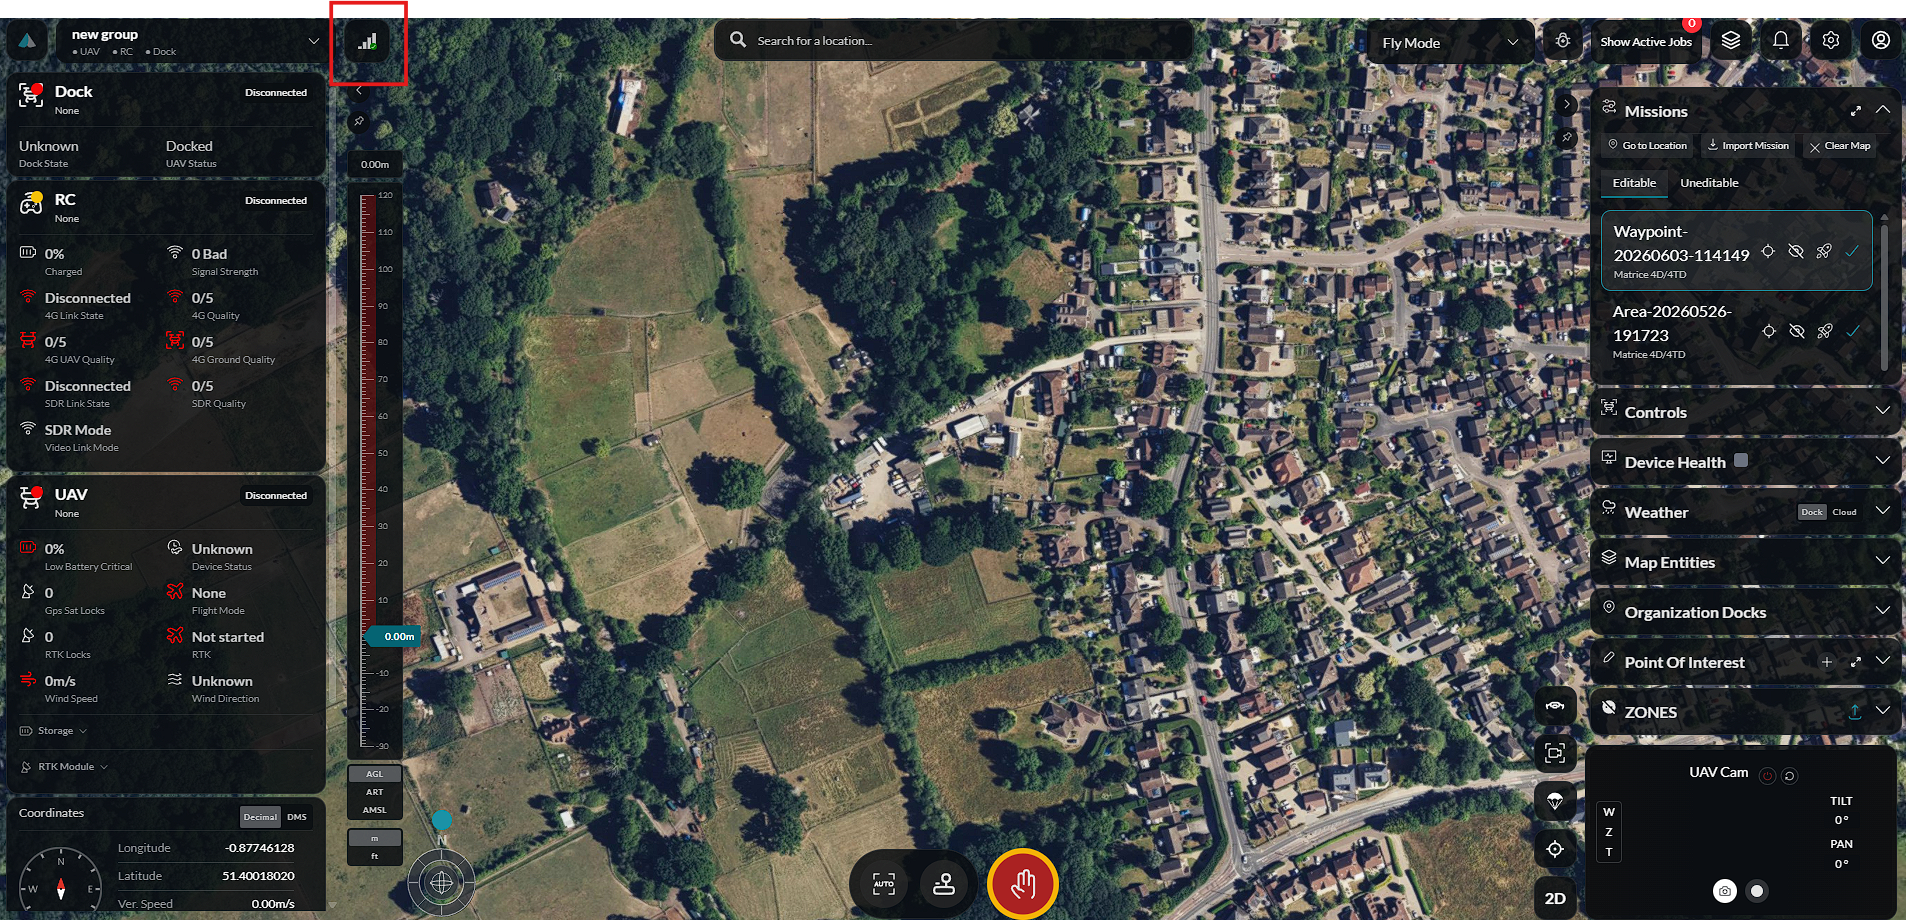
The Network Status indicator in the top navigation bar shows the health of your dashboard's internet connection and the connectivity to your dock station and remote controller. Check it before and during every flight.
Finding the Network Status Indicator
The network status icon lives in the top navigation bar. Its appearance reflects the overall connection quality:
| Icon State | Meaning |
|---|---|
| Full signal bars | Good — latency and throughput are within normal range |
| Partial signal bars | Poor — one or more metrics are outside the acceptable range |
| Weak/no signal bars | Bad — connection is severely degraded |
Click the icon to open the Network Status dropdown for a detailed breakdown.
What the Dropdown Shows
The dropdown has three expandable sections — Dashboard, Dock Station, and Remote Control — each showing its own connection quality rating. Click a section header to expand it and see the individual metrics.
Dashboard
Shows the health of your computer's internet connection using browser-level network metrics:
| Metric | Description |
|---|---|
| Effectiveness Type | The estimated connection type reported by the browser (e.g. 4g, 3g, slow-2g) |
| Connection Type | The underlying network type (wifi, cellular, ethernet) |
| RTT | Round-trip time in milliseconds for the dashboard's upstream connection |
| Downlink | Estimated download bandwidth in Mbps |
The Dashboard section uses the following thresholds to determine quality:
| Condition | Status |
|---|---|
| RTT above 1500 ms or downlink below 1 Mbps | Bad |
| RTT above 300 ms or downlink below 5 Mbps | Poor |
| All other values | Good |
Dock Station
Shows the network metrics fetched from the dock station device:
| Metric | Description |
|---|---|
| Downlink | Download throughput at the dock, in Mbps, with Good/Poor/Bad status badge |
| RTT | Round-trip time at the dock, in ms, with Good/Poor/Bad status badge |
The section header shows the worst of the two metrics as the summary status (Good, Poor, or Bad).
Remote Control
Shows the same downlink and RTT metrics for the remote controller (RC) device, pulled from the same network monitoring endpoint as the dock station.
Connection Quality Ratings
For Dock Station and Remote Control the individual metric values are rated by the device-side monitoring service and returned as good, poor, or bad. The row-level summary takes the worst of the two metrics:
| If any metric is... | Row shows |
|---|---|
| bad | Bad |
| poor (none bad) | Poor |
| good only | Good |
Impact on Flight Operations
- Bad dashboard connection — you may experience delayed telemetry, dropped MQTT messages, or video stream interruptions. Do not start a mission.
- Bad dock station connection — dock commands (open, close, charge, deploy) may be delayed or fail. The drone may not receive mission updates reliably.
- Bad remote control connection — manual RC inputs may be delayed. Failsafe actions may not trigger as expected.
- Poor connection on any channel — monitor closely. Short bursts of poor connectivity are usually tolerable but sustained poor connectivity increases operational risk.
If connection quality is consistently poor, check your local network and the network at the dock site before flying.
Troubleshooting
- If the Dashboard row shows Bad, check your computer's internet connection.
- If Dock Station shows Bad but Dashboard is Good, the issue is likely at the dock site's network. Contact the site team.
- Network data for the dock and RC is refreshed automatically in the background. If values seem stale, close and reopen the dropdown to trigger a fresh fetch.