Analytics
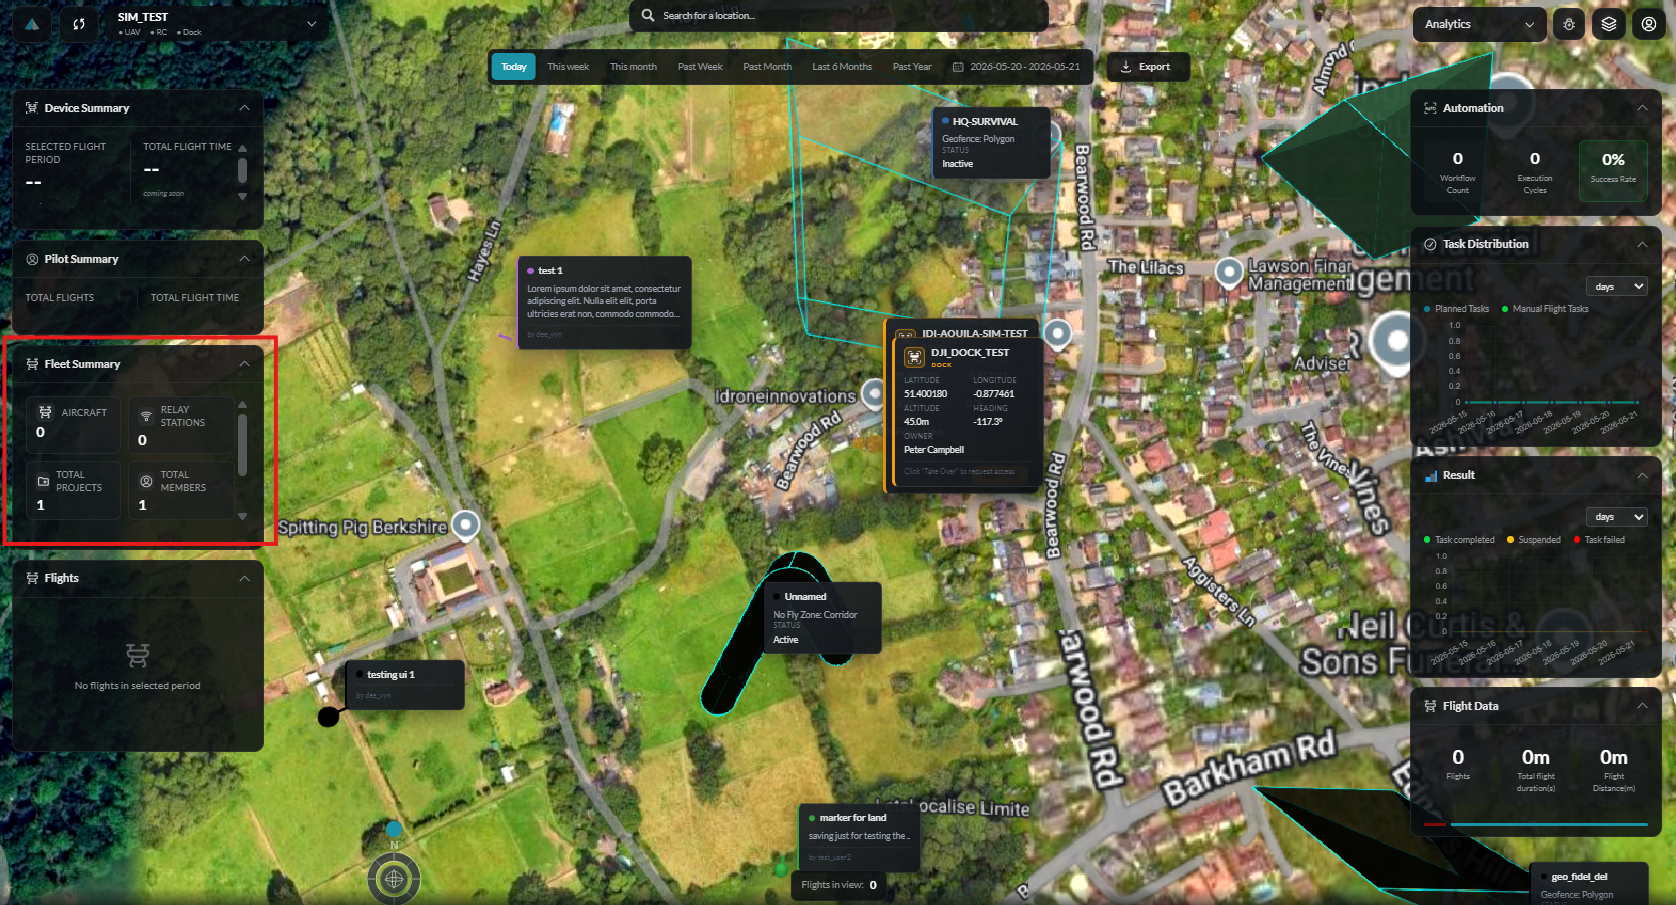
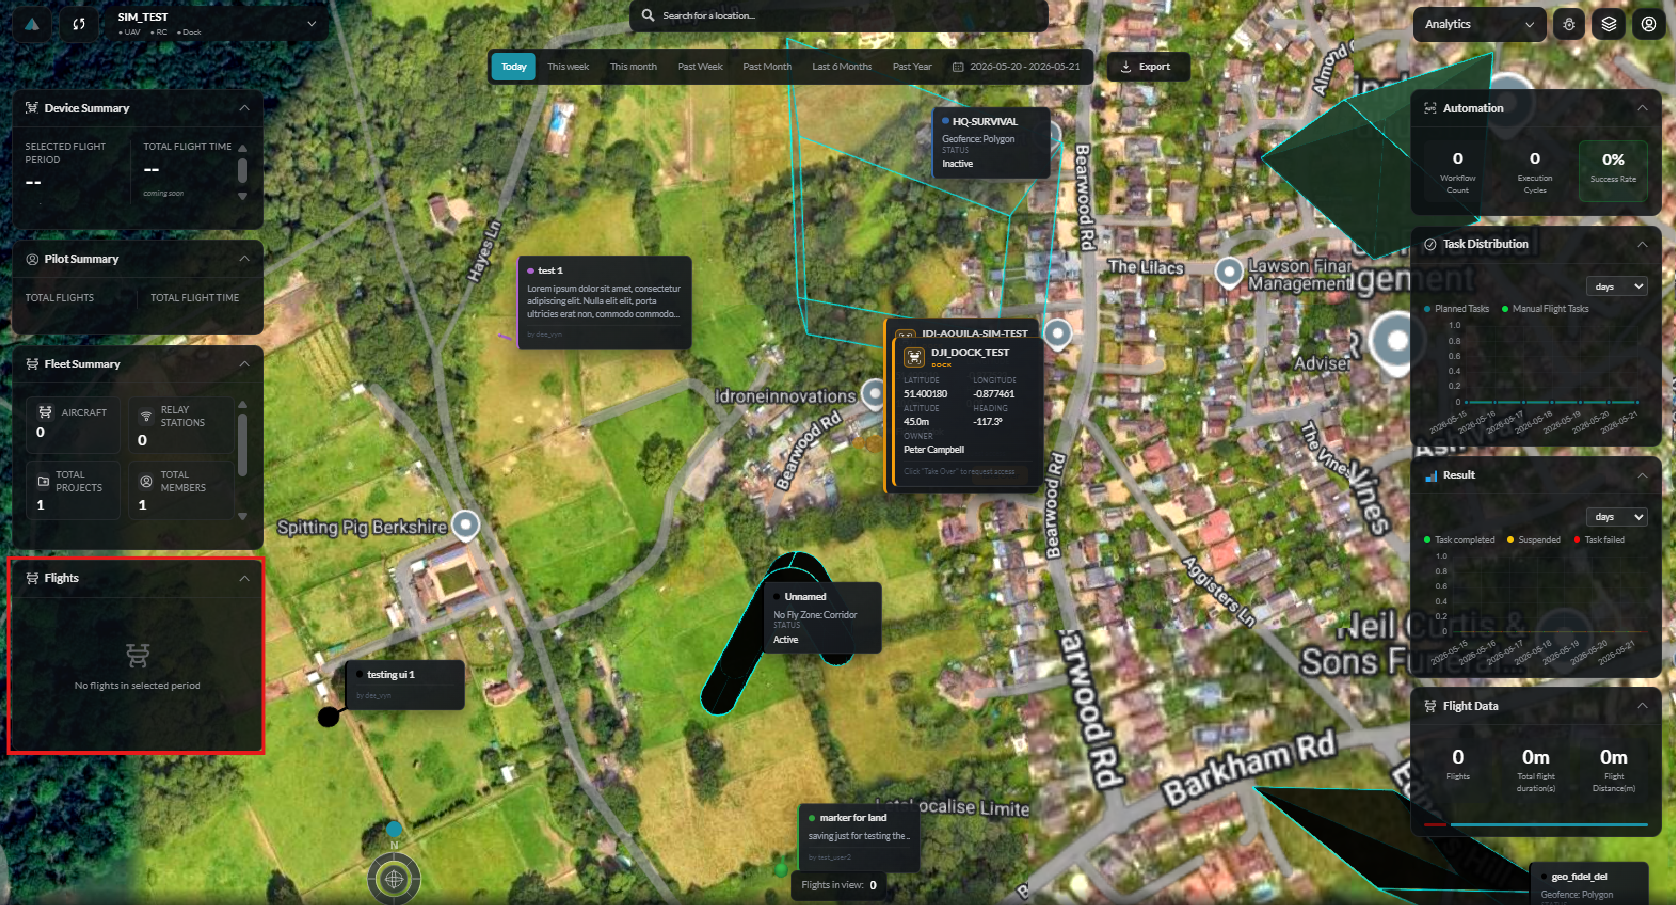
The Analytics dashboard provides comprehensive insights into flight operations, device performance, and pilot activity.
Overview
Analytics features include:
- Flight Statistics - Aggregated flight data and trends
- Device Summary - Performance metrics by aircraft
- Pilot Summary - Activity breakdown by user
- Time-Range Analysis - Historical data filtering
- Visual Charts - Interactive data visualization
Dashboard Layout
Header Section
- Time Range Selector - Filter data by date range
- Device Filter - Focus on specific aircraft
- Export Options - Download reports
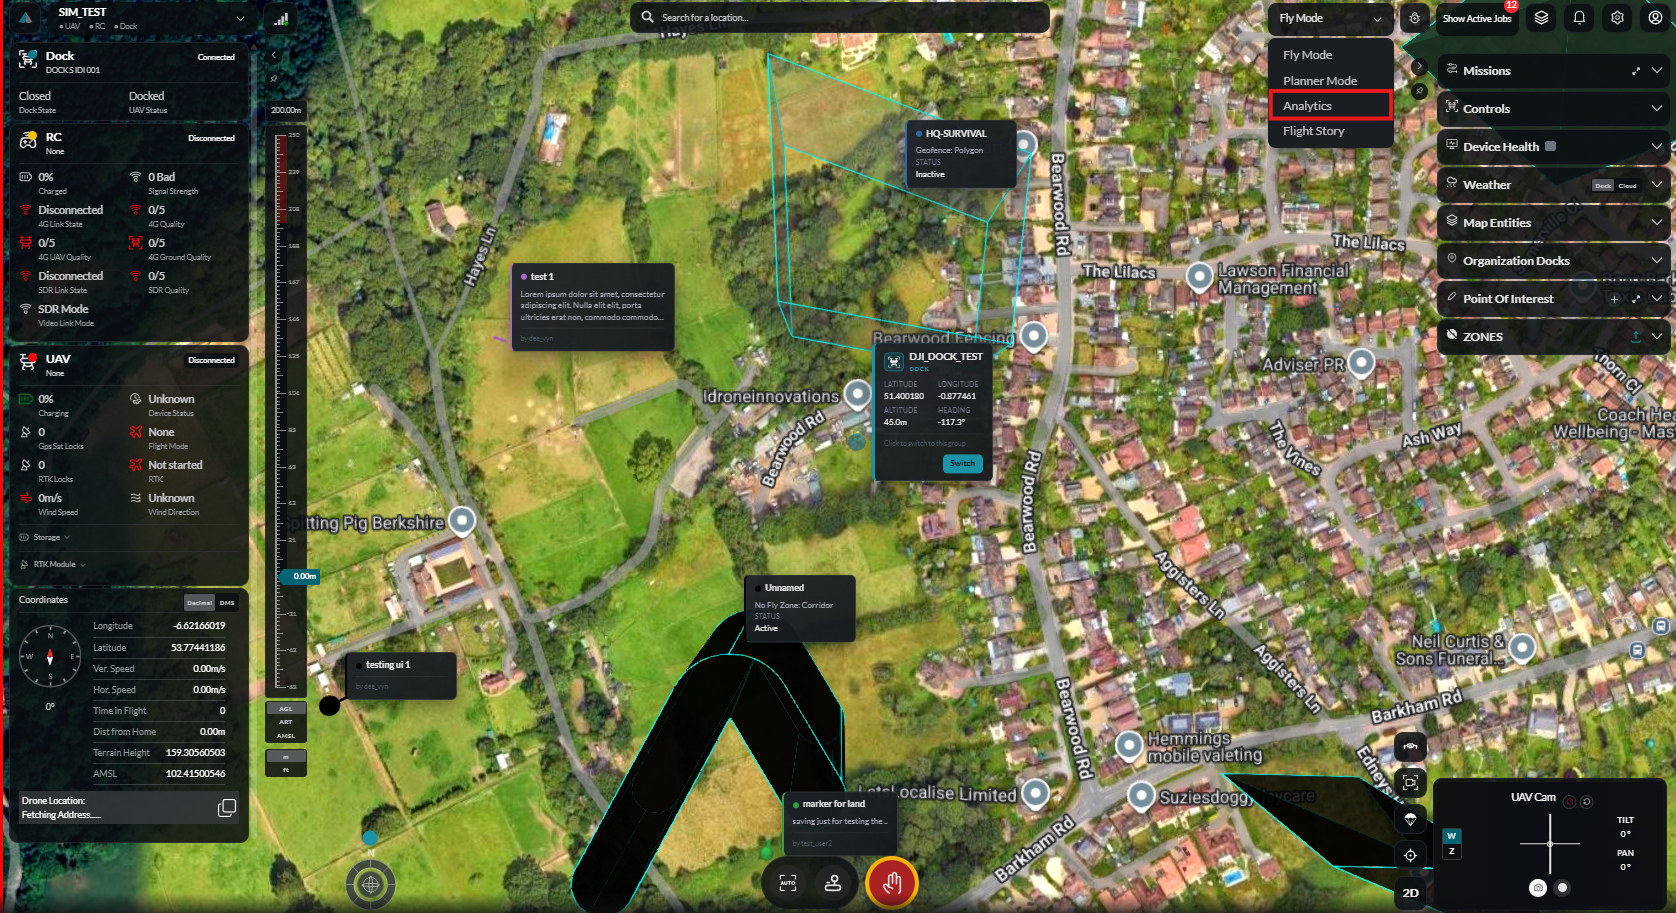
Summary Cards
Quick metrics at a glance:
| Metric | Description |
|---|---|
| Total Flights | Number of flights in selected period |
| Total Flight Time | Cumulative duration |
| Total Distance | Combined flight distance |
| Average Flight Duration | Mean flight length |
Charts Section
Interactive visualizations of flight data.
Detailed Tables
Tabular data with sorting and filtering.
Flight Statistics
Key Metrics
| Metric | Description |
|---|---|
| Flights | Total flight count |
| Duration | Total and average flight time |
| Distance | Total and average distance |
| Max Altitude | Highest altitude reached |
| Max Speed | Fastest recorded speed |
Trend Analysis
View how metrics change over time:
- Daily flight counts
- Weekly summaries
- Monthly trends
- Year-over-year comparison
Flight Distribution
Charts showing:
- Flights by time of day
- Flights by day of week
- Duration distribution
- Distance distribution
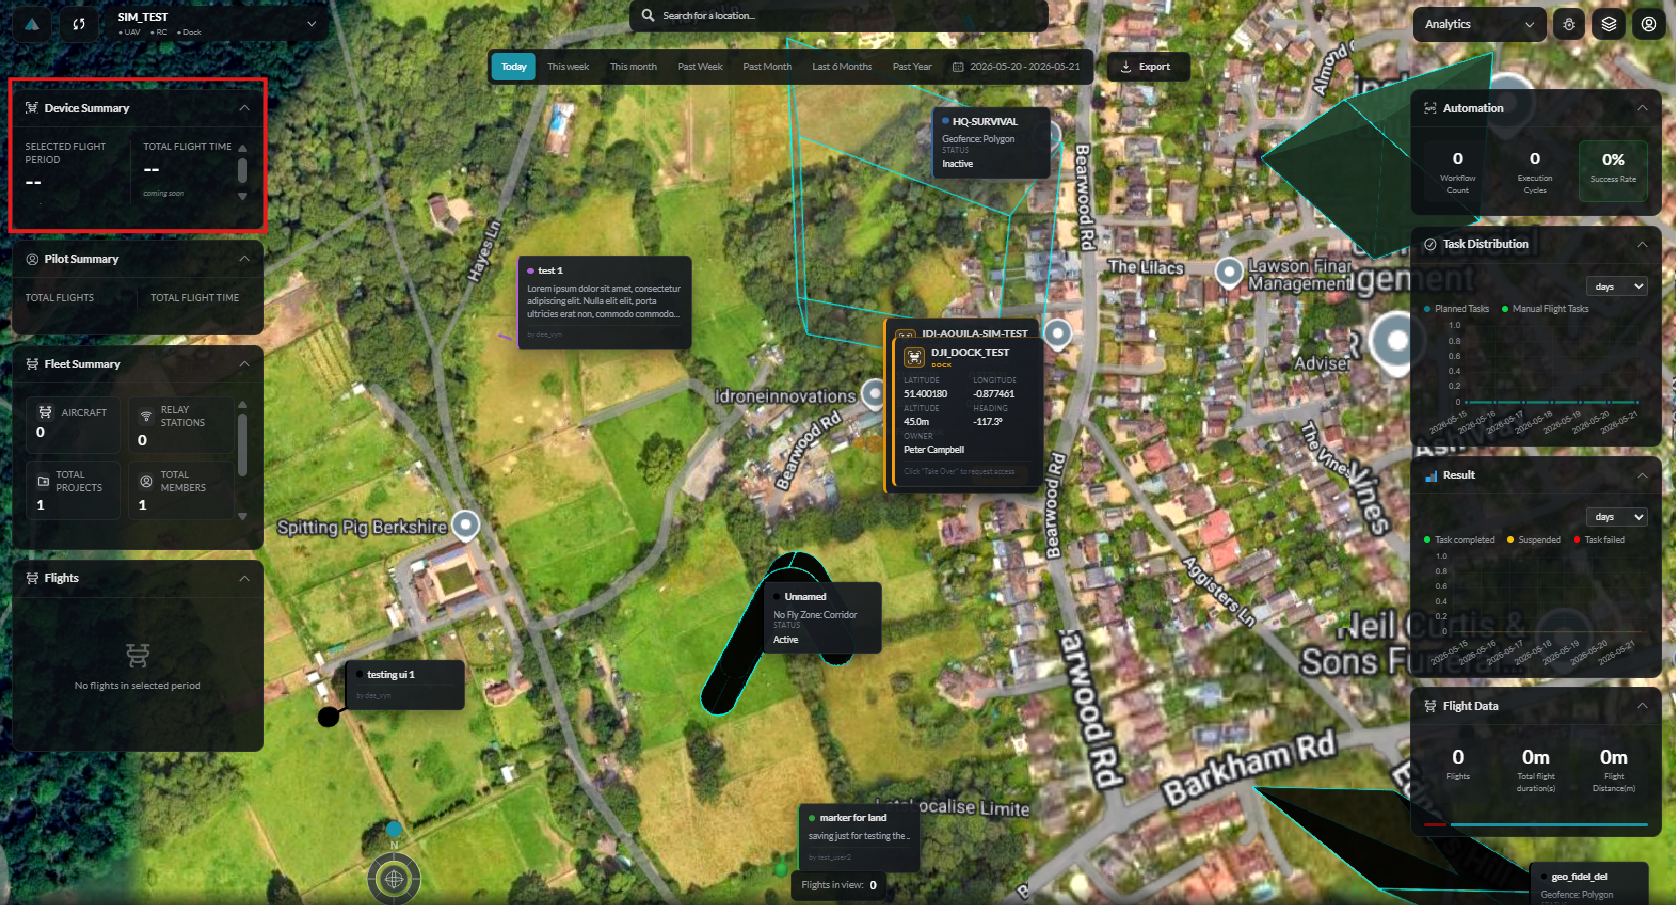
Device Summary
Per-Device Metrics
For each aircraft in your fleet:
| Metric | Description |
|---|---|
| Total Flights | Flights completed by this device |
| Flight Hours | Cumulative operational time |
| Battery Cycles | Number of charging cycles |
| Status | Current device condition |
Device Comparison
Compare performance across your fleet:
- Utilization rates
- Average flight duration
- Reliability metrics
Maintenance Tracking
Monitor device health:
- Flight hours since last service
- Component wear indicators
- Maintenance schedules
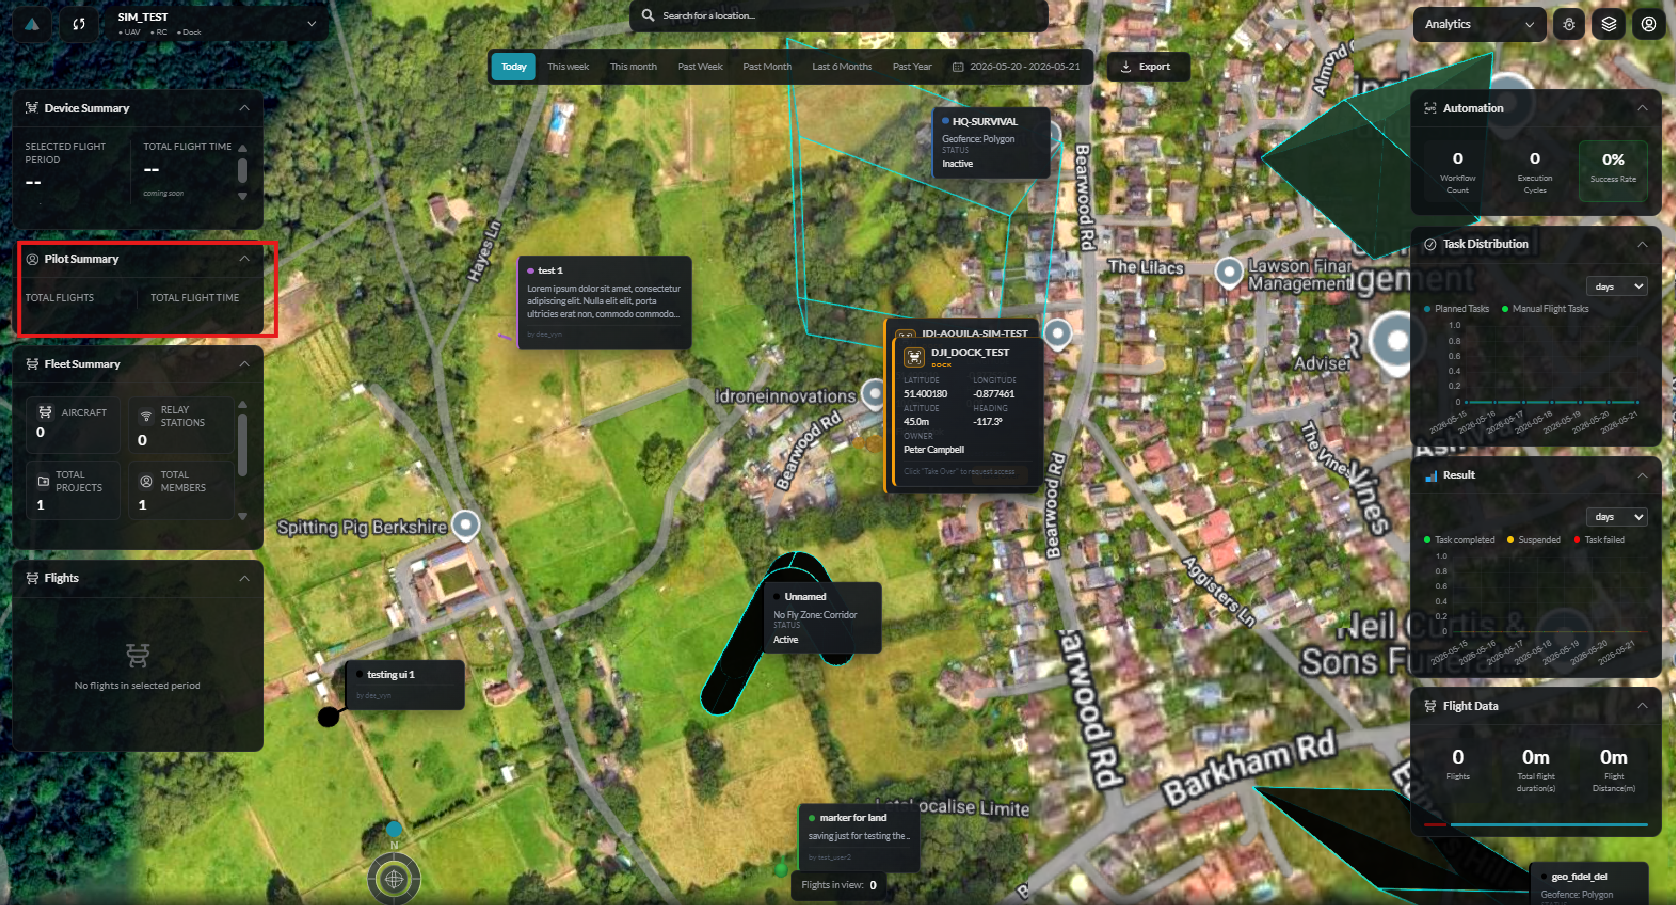
Pilot Summary
Per-Pilot Statistics
Track individual pilot performance:
| Metric | Description |
|---|---|
| Flights | Number of flights conducted |
| Flight Hours | Total time at controls |
| Devices Used | Aircraft operated |
| Missions Completed | Automated missions executed |
Pilot Comparison
Compare team member activity:
- Flight frequency
- Average flight duration
- Device preferences
Activity Timeline
View pilot activity over time:
- Daily operations
- Peak activity periods
- Inactive periods
Time-Range Analysis
Preset Ranges
Quick selection options:
- Today
- Yesterday
- Last 7 days
- Last 30 days
- This month
- Last month
- This year
Custom Range
Select specific dates:
- Click Custom Range
- Choose start date
- Choose end date
- Click Apply
Comparison Mode
Compare two time periods:
- Select primary range
- Enable Compare toggle
- Select comparison range
- View side-by-side metrics
Charts and Visualizations
Available Chart Types
| Chart | Use Case |
|---|---|
| Line Chart | Trends over time |
| Bar Chart | Comparisons between categories |
| Pie Chart | Proportion breakdown |
| Area Chart | Cumulative data |
Chart Interactions
- Hover - View detailed data points
- Click - Filter or drill down
- Zoom - Focus on specific periods
- Export - Save chart as image
Customization
- Toggle data series
- Change chart type
- Adjust time granularity
- Modify axis scales
Exporting Data
Export Formats
- PDF - Formatted report document
- CSV - Raw data for spreadsheets
- PNG - Chart images
Export Options
- Click Export button
- Select format
- Choose data to include
- Download file
Scheduled Reports
Set up automatic reports:
- Navigate to Report Settings
- Configure schedule (daily, weekly, monthly)
- Select recipients
- Choose included metrics
Filtering and Sorting
Filter Options
Narrow down data by:
- Date range
- Device/aircraft
- Pilot/user
- Flight type
- Status
Sorting
Sort tables by:
- Date (newest/oldest)
- Duration (longest/shortest)
- Distance (furthest/nearest)
- Alphabetical (name)
Search
Use the search bar to find specific:
- Flights by ID
- Devices by name
- Pilots by name
Best Practices
Regular Review
- Check analytics weekly for trends
- Monitor device utilization
- Track pilot activity balance
Data-Driven Decisions
- Identify peak operation times
- Optimize fleet utilization
- Plan maintenance schedules
Team Management
- Balance workload across pilots
- Identify training needs
- Recognize top performers
Flight Detail Modal
Clicking any flight record in the analytics table opens the Flight Detail Modal, which provides a focused summary of that individual flight: pilot, device, duration, distance, max altitude, max speed, and any recorded events or alerts.
Telemetry Table
The Telemetry Table displays raw time-series data recorded during a flight. Each row represents a telemetry snapshot and columns include timestamp, position, altitude, speed, battery level, and signal strength. The table supports column sorting and CSV export.
Flight Map View
The Flight Map View renders the recorded GPS track of a selected flight on an interactive 3D map. You can scrub through the timeline to replay the flight path, view altitude changes over terrain, and inspect individual telemetry points spatially.
Troubleshooting
Data Not Loading
- Check date range selection
- Verify network connection
- Clear browser cache
Incorrect Metrics
- Verify filter settings
- Check time zone configuration
- Refresh the page
Export Failures
- Reduce data range for large exports
- Try different export format
- Check browser download settings